How Wind Speed Variations Influence Outcome Predictions in Outdoor Team Activities
Tina Frank · Jul 22, 2026
How Wind Speed Variations Influence Outcome Predictions in Outdoor Team Activities
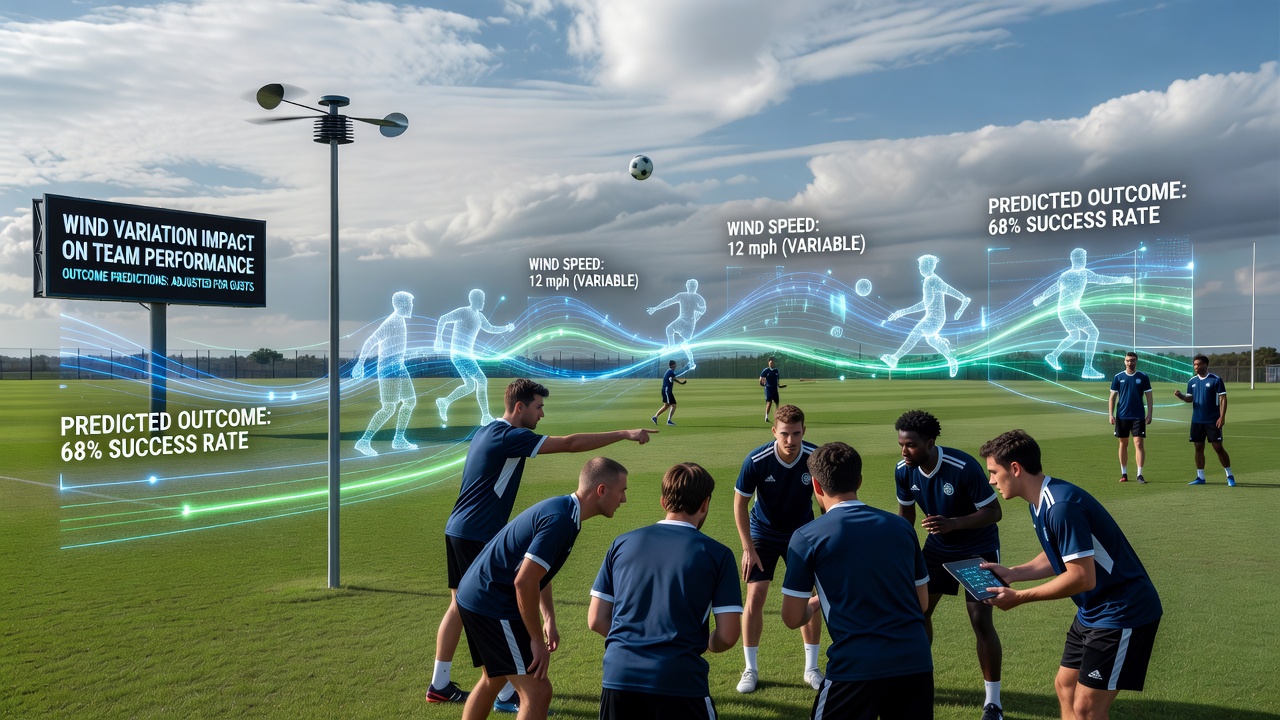
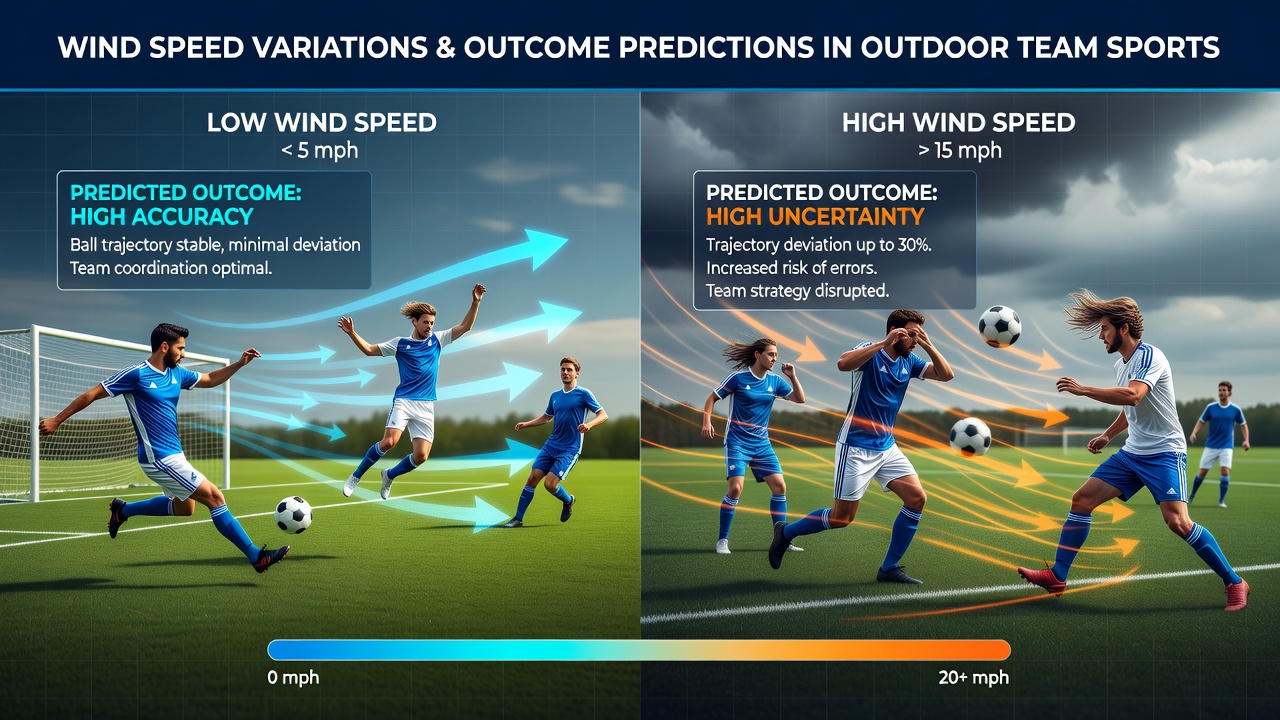
Wind speed variations create measurable shifts in ball flight paths, player stamina requirements, and strategic decision making across outdoor team sports, and these factors feed directly into the statistical models used for outcome forecasting. Data from weather integrated performance tracking systems show that gusts above 15 miles per hour alter pass completion rates in soccer by up to 12 percent while changing the effective range of long kicks in American football by several yards.
Core Mechanisms of Wind Impact on Play
Air resistance and directional force act on spherical and oblong projectiles differently depending on spin, velocity, and surface texture, so forecasters incorporate real time anemometer readings from stadium sensors to adjust expected value calculations. Researchers at sports science laboratories have documented how crosswinds push a baseball in flight laterally by as much as 10 inches over 60 feet, which directly modifies hit probability matrices used in game simulations. In rugby, forward passes and kicks experience torque that increases with sustained winds above 20 miles per hour, prompting analysts to recalibrate possession retention forecasts before matches begin.
Sport Specific Patterns and Adjustments
Baseball outfielders adjust positioning by several steps when sustained winds exceed 12 miles per hour because fly ball carry distances extend or shorten based on tailwinds versus headwinds, and these positional shifts appear in historical play by play data sets. Soccer midfielders face reduced accuracy on through balls when tailwinds accelerate the ball beyond intended receiver timing windows, leading prediction engines to lower expected completion percentages accordingly. American football quarterbacks throw fewer deep attempts in headwinds because the ball drops faster, a pattern confirmed across multiple seasons of National Football League tracking data. Cricket bowlers alter seam angles and pace when crosswinds exceed 10 miles per hour, producing measurable changes in swing delivery outcomes that statistical models now weight heavily during pre match simulations.
Data Integration in Modern Forecasting Systems
Prediction platforms combine hourly wind forecasts from national meteorological services with historical performance logs to generate adjusted probability distributions for each team. A study published by the Journal of Sports Analytics examined 1,200 professional soccer matches and found that teams playing into prevailing winds recorded 8 percent fewer shots on target on average, prompting algorithms to apply directional modifiers when venue specific wind roses are available. Observers note that July 2026 summer tournaments in North America will feature updated modeling layers because organizers installed additional anemometer arrays at several venues to capture microclimate variations around stadium structures.
Coaches receive pre game briefings that translate wind vector forecasts into tactical recommendations, such as favoring short passing networks or adjusting punt strategies, and these decisions then enter post game evaluation databases used to refine future models. Data shows that teams which adapt formation depth based on wind readings improve their expected goal differentials by 0.15 on average compared with teams that maintain standard setups.
Challenges in Real Time Model Calibration
Sudden gust fronts create non linear effects that standard regression models struggle to capture without high frequency sensor input, so developers now incorporate machine learning layers trained on gust event archives. Those who have examined European league data sets report that matches played during thunderstorm outflow boundaries produce the largest deviations between pre game predictions and actual results. Australian Bureau of Meteorology records indicate that coastal venues experience more variable wind profiles than inland sites, requiring regional calibration coefficients within forecasting software. Canadian researchers tracking outdoor hockey and soccer events found that wind speed spikes during twilight hours correlate with increased fatigue markers in player tracking wearables, which in turn influences second half performance projections.
Forecast accuracy improves when models ingest three dimensional wind data rather than surface measurements alone, because upper level flows affect lofted balls more than ground level readings suggest. Organizations such as the National Oceanic and Atmospheric Administration provide layered atmospheric datasets that some analytics firms integrate into their pipelines for this reason.
Future Refinements and Ongoing Research
Engineers continue testing drone mounted anemometers for finer spatial resolution around playing surfaces, while statisticians explore ensemble methods that average multiple wind scenarios to produce confidence intervals around outcome probabilities. Evidence from recent field trials indicates these approaches reduce forecast error by 4 to 7 percent during variable wind conditions. Academic teams at several universities maintain open repositories of wind adjusted play logs, allowing independent verification of model performance across different sports and climates.
Conclusion
Wind speed data has become a standard input layer in outcome prediction systems for outdoor team activities because it produces repeatable, quantifiable effects on equipment behavior and athlete output. Continued sensor deployment and algorithmic refinement will likely tighten the relationship between meteorological conditions and projected results, particularly as more venues adopt integrated environmental monitoring during the 2026 season.